Efficiency measurement of bicycle transmission
A Never Ending Story?
To keep, the regenerative discussions over working efficiency fresh, we would like to draw attention to a few points which hopefully explain the difficulty in defining the exact efficiency of a transmission system.
With these Arguments, we hope to increase the understanding for these particular problems.
1. Validity of the Modeling
The known test methods used involve a low test performance of between 80W and 200W, measured with a constant level of torque. These power figures are supposed to represent the typical cycling situation. From the reasons which are written in this paper, we conclude that this test performance is not adequate.
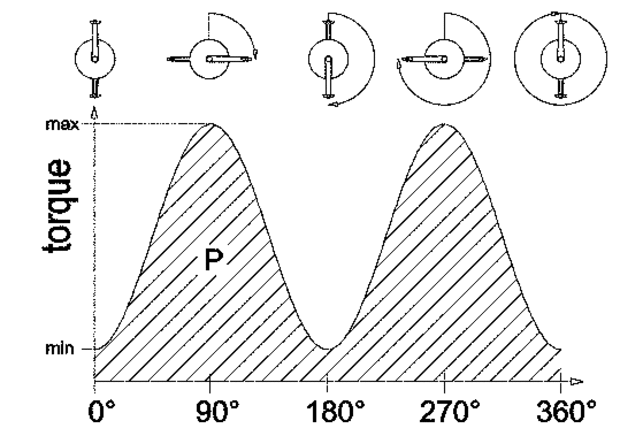
The power produced by the cyclist consists of a relatively constant speed and widely variable torque due to the crank kinematics. Measurements show that while there are at different power inputs speed variations of about 5% are typical, the torque variations can be over 90% throughout a single crank revolution.
Table 1 shows the results at different power inputs.
The power characteristics are largely governed by the torque behavior. Figure 1 shows the typical power gradient through one rotation of the drive-shaft.
The cyclical torque of a cyclist produces an alternating load situation on all power transmitting parts, chain links, chain rings, bearings, gears, etc, which is very important to keep in mind when evaluating the mechanical losses which effect the efficiency.
A precise simulation of the cyclical torque is not easy to produce in the laboratory and from measuring point of view excessively costly. For this reason, when measuring mechanical efficiency electric motors with a constant power input are used. This brings up the question of how to choose the appropriate power input when using a constant torque so that the efficiency measurement correlates to the efficiency that would be measured with the cyclical load actually applied in the real world.
We encountered a similar problem when designing our chain and chain ring wear test, which is operated at constant torque. Extensive comparison between components used in real world and components worn out on the test bench show the following: If the field tested components were used at an average of 150W with an average cyclic torque between 5Nm and 30Nm, this correlated to a chain tested at a constant torque of 30Nm in our laboratory.
It can be assumed that the reasons that cause the wear of components are the same ones that are responsible for the efficiency. Therefore you can deduce from the comparisons that a in a lab test, a constant power input using the maximum value of the cyclic load produces results that are closer to reality than choosing a constant power input using the average load.
For example, an average cycling power 80W in real life should be simulated by a test bench power of 160W at the same speed.
2. Interpretation of the measurements
In order to give a correct interpretation of the results it is important to establish what the losses are composed of.
Losses are created by friction. The value is determined by the type of friction (rolling or sliding), the size of surfaces in contact, type of surface finish, material hardness, lubrication, combination of the rubbing parts. Two separate types of losses exist in bicycle transmissions:
a) Power dependent losses. These are created by friction of parts that are moving under a driving load, i.e. chain links, gears, bearings, etc. The quantity of the loss grows proportional to the transmitted power.
b) Power independent losses. These losses are created by friction of moving parts and are not changed by the driving load, in other words these losses are constant regardless of the load applied, i.e. gaskets, shims, lubricants, the quantity of loss depends on speed, temperature, and lubricant viscosity.
In the following example, two bicycle transmission systems are compared. Both have a 91% efficiency at 50W input. They have two different power dependent and power independent losses.
Two things become clear from the table:
- Power independent losses predominate at lower power inputs.
- Power dependent losses predominate at higher power inputs.
Figure 2 shows the correlations.
In addition to curves for systems A and B, Figure 2 also shows curves for systems C and D. The curve for system C describes how the power independent losses increase from one to two Watts due to temperature or lubricating film changes at the seal of system A. The curve for system D describes the efficiency changes of system B with a reduction from three to two Watts of the power independent loss for the same reason.
The examples show that for power input of less than 200W that even small changes of +/- 1W of power independent losses play a large role in the overall efficiency. Since power independent losses are the result of a complex relationship between speed changes, temperature changes (created by own friction heating), and lubrication. These variations can occur in the test situation.
If power input is less than 200W, it must be confirmed that the influence of those variations are verified by repeated tests. Over 200W the influence of power independent losses can be neglected.
Knowing that, all measurement values shouldn’t be absolute values, but rather represented as a range of values showing the corresponding upper and lower boundaries.
3. Reason for efficiency measurements
The reason for efficiency measurements is to find out which one of the different bicycle transmissions converts the most of the bicyclist’s power into forward motion. To propel the rider forward in the most efficient manner, it is important that the rider be able to choose an appropriate gear for the given load or riding situation, a gear that is suitable to the rider’s fitness level.
The development of power in the muscles is subject to a grade of efficiency. This efficiency is the ratio of metabolic capacity and the delivered mechanical power, i.e. the power at the crank. The efficiency depends on the muscle power combined with the speed of movement, if both variables reach their optimum, the muscle efficiency can increase by 25%.
The differences in muscle efficiency between positive and negative fatigue ratios (bodily stress/developed power) can easily vary by 10%. This is of much larger value than the variation of mechanical efficiencies of various bicycle transmissions systems.
Table 4 shows an example of two bicycles which are being pedaled with the same power (measured at the rear wheel).
Rider A is using a perfect gear ratio for the situation and his muscle efficiency is 24%. His bicycle transmission is moving in a gear with relatively poor mechanical efficiency of 93%. Rider B is using an unfavorable gear with a high efficiency of 97%., however, because of the unfavorable speed, his muscles work at 22% efficiency. The overall efficiency shows taking into consideration muscle and transmission losses that rider A is riding more efficiently even though his transmission efficiency is lower than rider B’s.
In order to use the rider as a “bicycle engine” most effectively, the ratio increments between the gears are as important as a good mechanical efficiency. The most efficient energy conversion is very limited using transmissions with only a few gears. A larger selection of gears with smaller increments make a favorable energy conversion possible in a wider range of riding situations, but only if the correct gear is used. Sport medical research shows that the increments between gears must be smaller than 15% to benefit the rider’s efficiency.
Under this point of view it does not make sense to compare transmissions with only a few gears, large gaps, and small overall range, with transmissions with many gears, small increments, and a large range of gears. A comparison of different transmission systems should always take into consideration its application.
4. Conclusions
A) All measurements below 200W need to be evaluated cautiously because the influence of the variations of the power independent losses are very high.
B) From a practical point of view changes of efficiency play a major role only when riding above the recreational level i.e. greater than 100W. **Consider the influence of the cyclic torque curve on the efficiency test runs below 200W and at constant torque curve don’t make sense from a practical point of view.
C) When comparing transmission systems range of gears and number of gears should be taken into consideration in addition to the efficiency. Only by doing that the practical effect can be described.
5. Rohloff measurement results
We would like to point out that the points represented here should be a stimulus for a discussion since there are so many open questions in the field of practical efficiency measurements regarding bicycle transmission systems. As a comparison, in figure 3 are our efficiency measurements of a 24-speed derailleur system (46-36-26 toothed chain rings and Shimano XT 11-28 toothed cassette), and the Rohloff SPEEDHUB 500/14 (46/16). Both systems had been broken-in for 100km.
The measurements include the losses of the complete transmission, bottom bracket, chain, hubs, etc.
In order to simulate a strong rider who applies about 160W and produces a maximum torque of 50Nm (285N @ pedal), the measurements were taken at a power of 314W with constant torque.
- Crank speed: 60min-1
- Brake power(constant): 314W
- Torque: 50Nm
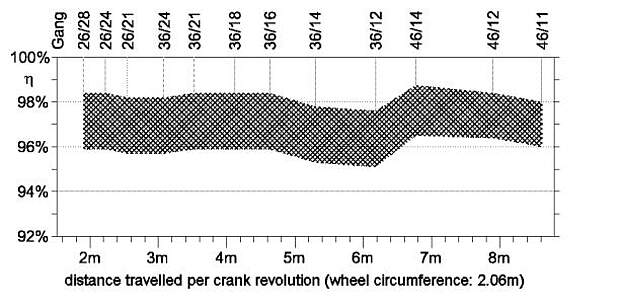
The reproducibility of the results and their precision was verified by repeated test runs. Figure 3 shows the efficiency of the derailleur system plotted vs. distance per crank revolution. Note the gear ratios are not consistently spaced as can be seen on the plot.
Figure 3 shows the efficiency of a derailleur gear system throughout the overall gear range: Distance traveled per crank rotation with a wheel circumference of 2.06m.
The distance between the gear ratios differs as a direct comparison with the distance between the individual gear ratios. The derailleur gear system is then tested in a clean and well lubricated condition. To achieve a practical result, the chain and sprockets will then be replaced with components which have been subject to 1000km use and show the amount of dirt which would have been collected over this time span. The characteristic diagram includes both of these examples, although the worn components are generally 1% lower.
The hight of the characteristic diagram also includes an approximate measurement tolerance of +/-0,5%.
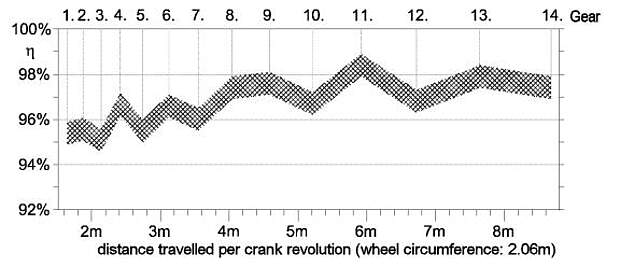
Figure 4 shows the working efficiency characteristic diagram of the Rohloff SPEEDHUB 500/14 throughout the overall gear range.
Because the Rohloff SPEEDHUB 500/14 incorporates evenly spaced gear increments, the distances between each is shown to harmonically increase exponentially. Here too, the chain and sprockets were swapped out for components which have been subject to 1000km use in order to give a practical result. The efficiency difference was not measurable in this case.
The hight of the characteristic diagram also includes an approximate measurement tolerance of +/-0,5%.
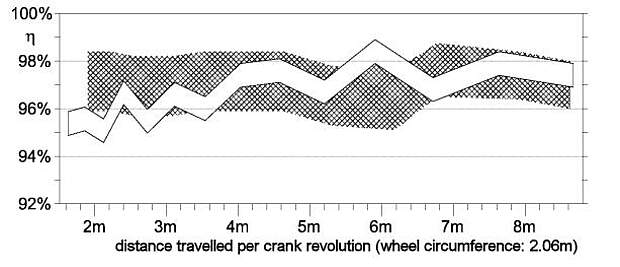
Figure 5 shows the efficiency ranges of figures 3 and 4 on the same plot for comparison.
The efficiency of internally geared hubs drops when the number of working planetary sets increases. This fact must be shown in the efficiency results of the gear hubs tested. In the SPEEDHUB 500/14 there are three planetary gear sets that can be used in series. The unique gear ratios are created by engaging different combinations gears within these planetary sets.
Table 9 shows the number of the active (working) planetary gear sets per gear.
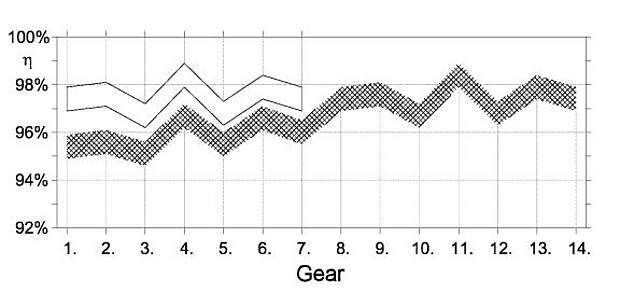
Figure 6 shows the range of efficiency of the SPEEDHUB 500/14 plotted vs. gear number. The efficiency plots confirms the number of the active planetary sets as represented in Table 9.
Gear 11 has the highest efficiency because it is the direct drive gear, no planetary gear sets are activated.
The curve between gears 1 and 7 corresponds with the curve between gears 8 and 14. This is due to the fact that the first two planetary gear sets are shifted between gears 1 and 7 in the same way as they are between gears 8 and 14, however gears 1 to 7 have an extra planetary gear set activated providing a compound low gear. The efficiency between gears 1 and 7 is about 2% lower due to the use of the third planetary gear set.
In order to show this fact more clearly the curve between gears 8 and 14 has been copied and shifted to the left so that it can be compared with the curve representing the efficiencies of gears 1 to 7. The results correspond to the gear combination or respectively to the number of active planetary gears inside the hub.
6. Conclusion
The explanations show clearly that the efficiency of bicycle transmissions depend heavily upon many factors. The research into each of these factors individually involves an enormous effort and is incredibly complex which adds to the cost of such research. In order to measure real-life values, factors such as contamination, lubrication, wear and even production tolerances need to be included as well as elements of athletic medical research. We believe that there is still a great deal of room for further tests and in-depth discussions into this particular area.
